Re-learning machine learning: Rwandan crop data
06 July 2026In my previous post about machine learning I wrote a neural net classifier for an environmental dataset that I found on Kaggle. This time I wanted to work with a real-world dataset, and I came across one called “Ground reference dataset for crop type mapping and monitoring in four districts of Rwanda”, comprising survey responses collected from Rwandan farms in May and June 2025.
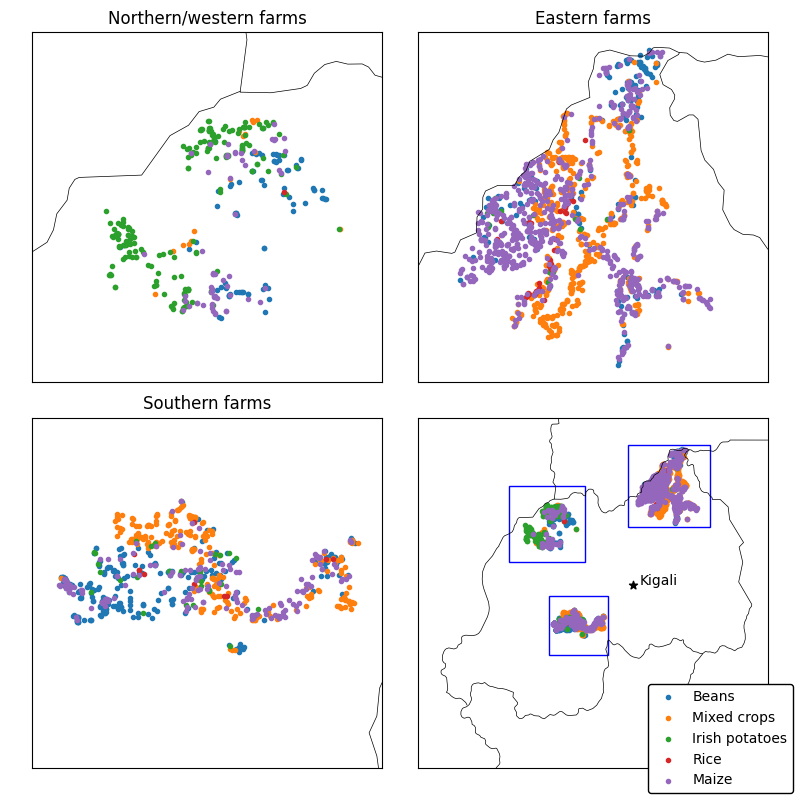
I plotted the surveyed farms with Basemap, a really nice library for visualising map data. The farms in the dataset were chosen partly for their proximity to population centres, which is why they are so clustered.
The data has some interesting features, like how much/what type of fertilizer the farmers are using, whether the crops are to be sold or eaten, and whether they are doing anything to reduce erosion. But the dataset isn’t really large enough to do any meaningful regression on how those features affect crop yield, for example.
Each farm also had four photographs taken of it, one in each cardinal direction. I used those photos to build a neural net to classify crop type based on a photo. It was partially successful. I used only beans, potatoes, and maize for this, because mixed crops should be hard to distinguish and there were only 47 rice farms surveyed, out of 2739 total.
The photos were mostly taken on mobile phones and are of variable sizes. I sliced them into 240x240 pixel chunks, and then shrunk those chunks to 32x32 pixels.1
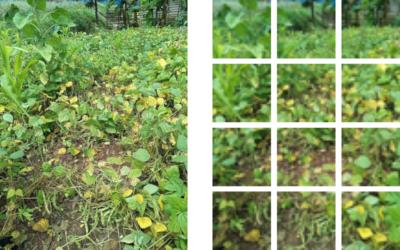
A bean plot in southern Rwanda. Image copyright (CC-BY-4.0) Benson Kipkemboi Kenduiywo, Anastasia Wahome, Stephen Sande Ngondi, Joseph Chemutt, Marie Ange Tesire, Samuel Ishimwe, Yves Hategekimana, Lilian Ndungu, Golo Rademacher, Aniruddha Ghosh.
My classifier did a decent job of learning to identify maize,2 but beans were a challenge and potatoes were essentially a guess. I have some theories about this:
- Many farms that were reported as having one main crop still “intercrop” with others. Since potatoes grow low to the ground, they may be being hidden by the other crops.
- There is a discrepancy in data sizes: 1010 maize farms, 610 bean farms, and 246 potato farms. This was possibly too skewed for the model to properly learn.
In any case, I now know more about what a potato plant looks like than I did a few days ago.